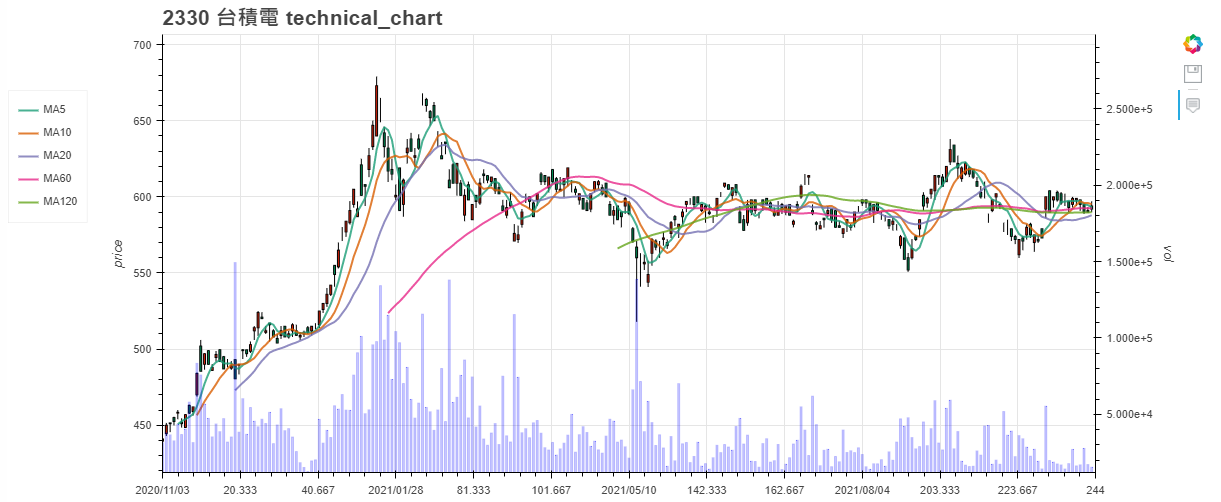

參考老師的Blog文章,內附的程式碼就可以無痛升級美麗圖表,但是我架設在Django上,需要調整一下來顯示在Django頁面。
在Django的View.py 上收先引用:
from bokeh.embed import components

from bokeh.resources import CDN
在程式加入Blog內的function來產生資料跟已經畫好的圖表,使用components,產生javascript與 html區塊,最後在render頁面帶入參數
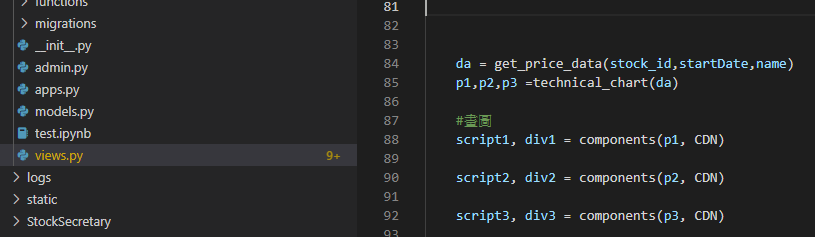
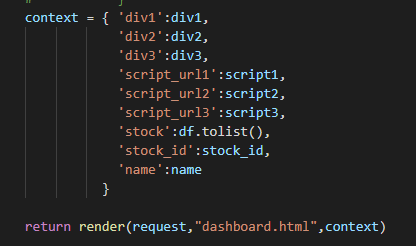
在Django的templates頁面上,下圖是圖表的Html的Div區塊
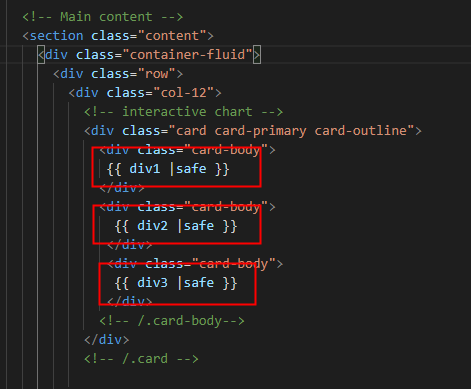
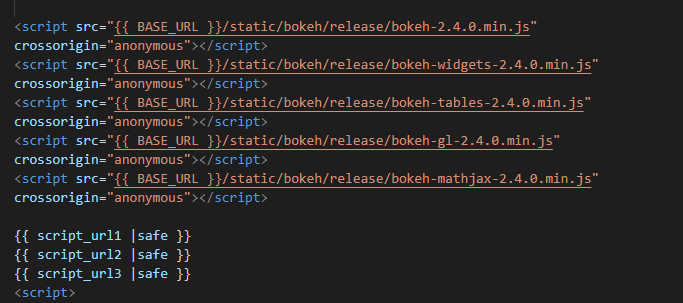
下圖是在script></script> 區塊中,先引用bokeh的js,我直接下載到我的本機,避免版本到時候又變了壞掉,最後使用bokeh產生的的javascript語法。
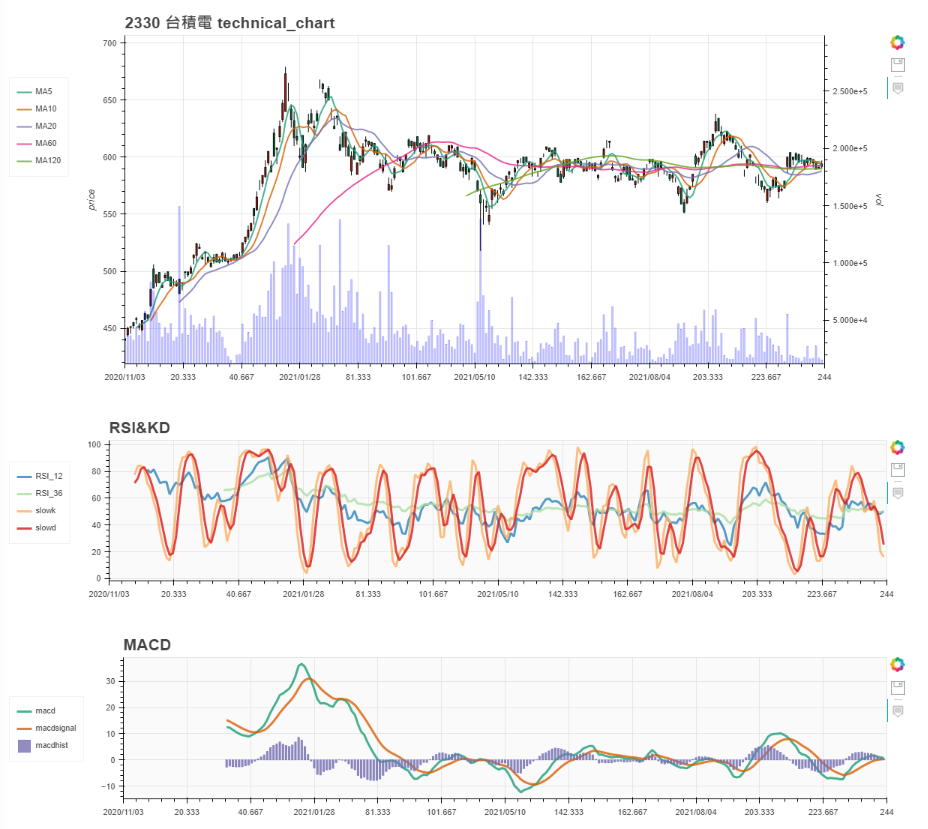
就可以產生美美的圖了
Comments
comments powered by Disqus